Plotting orbits
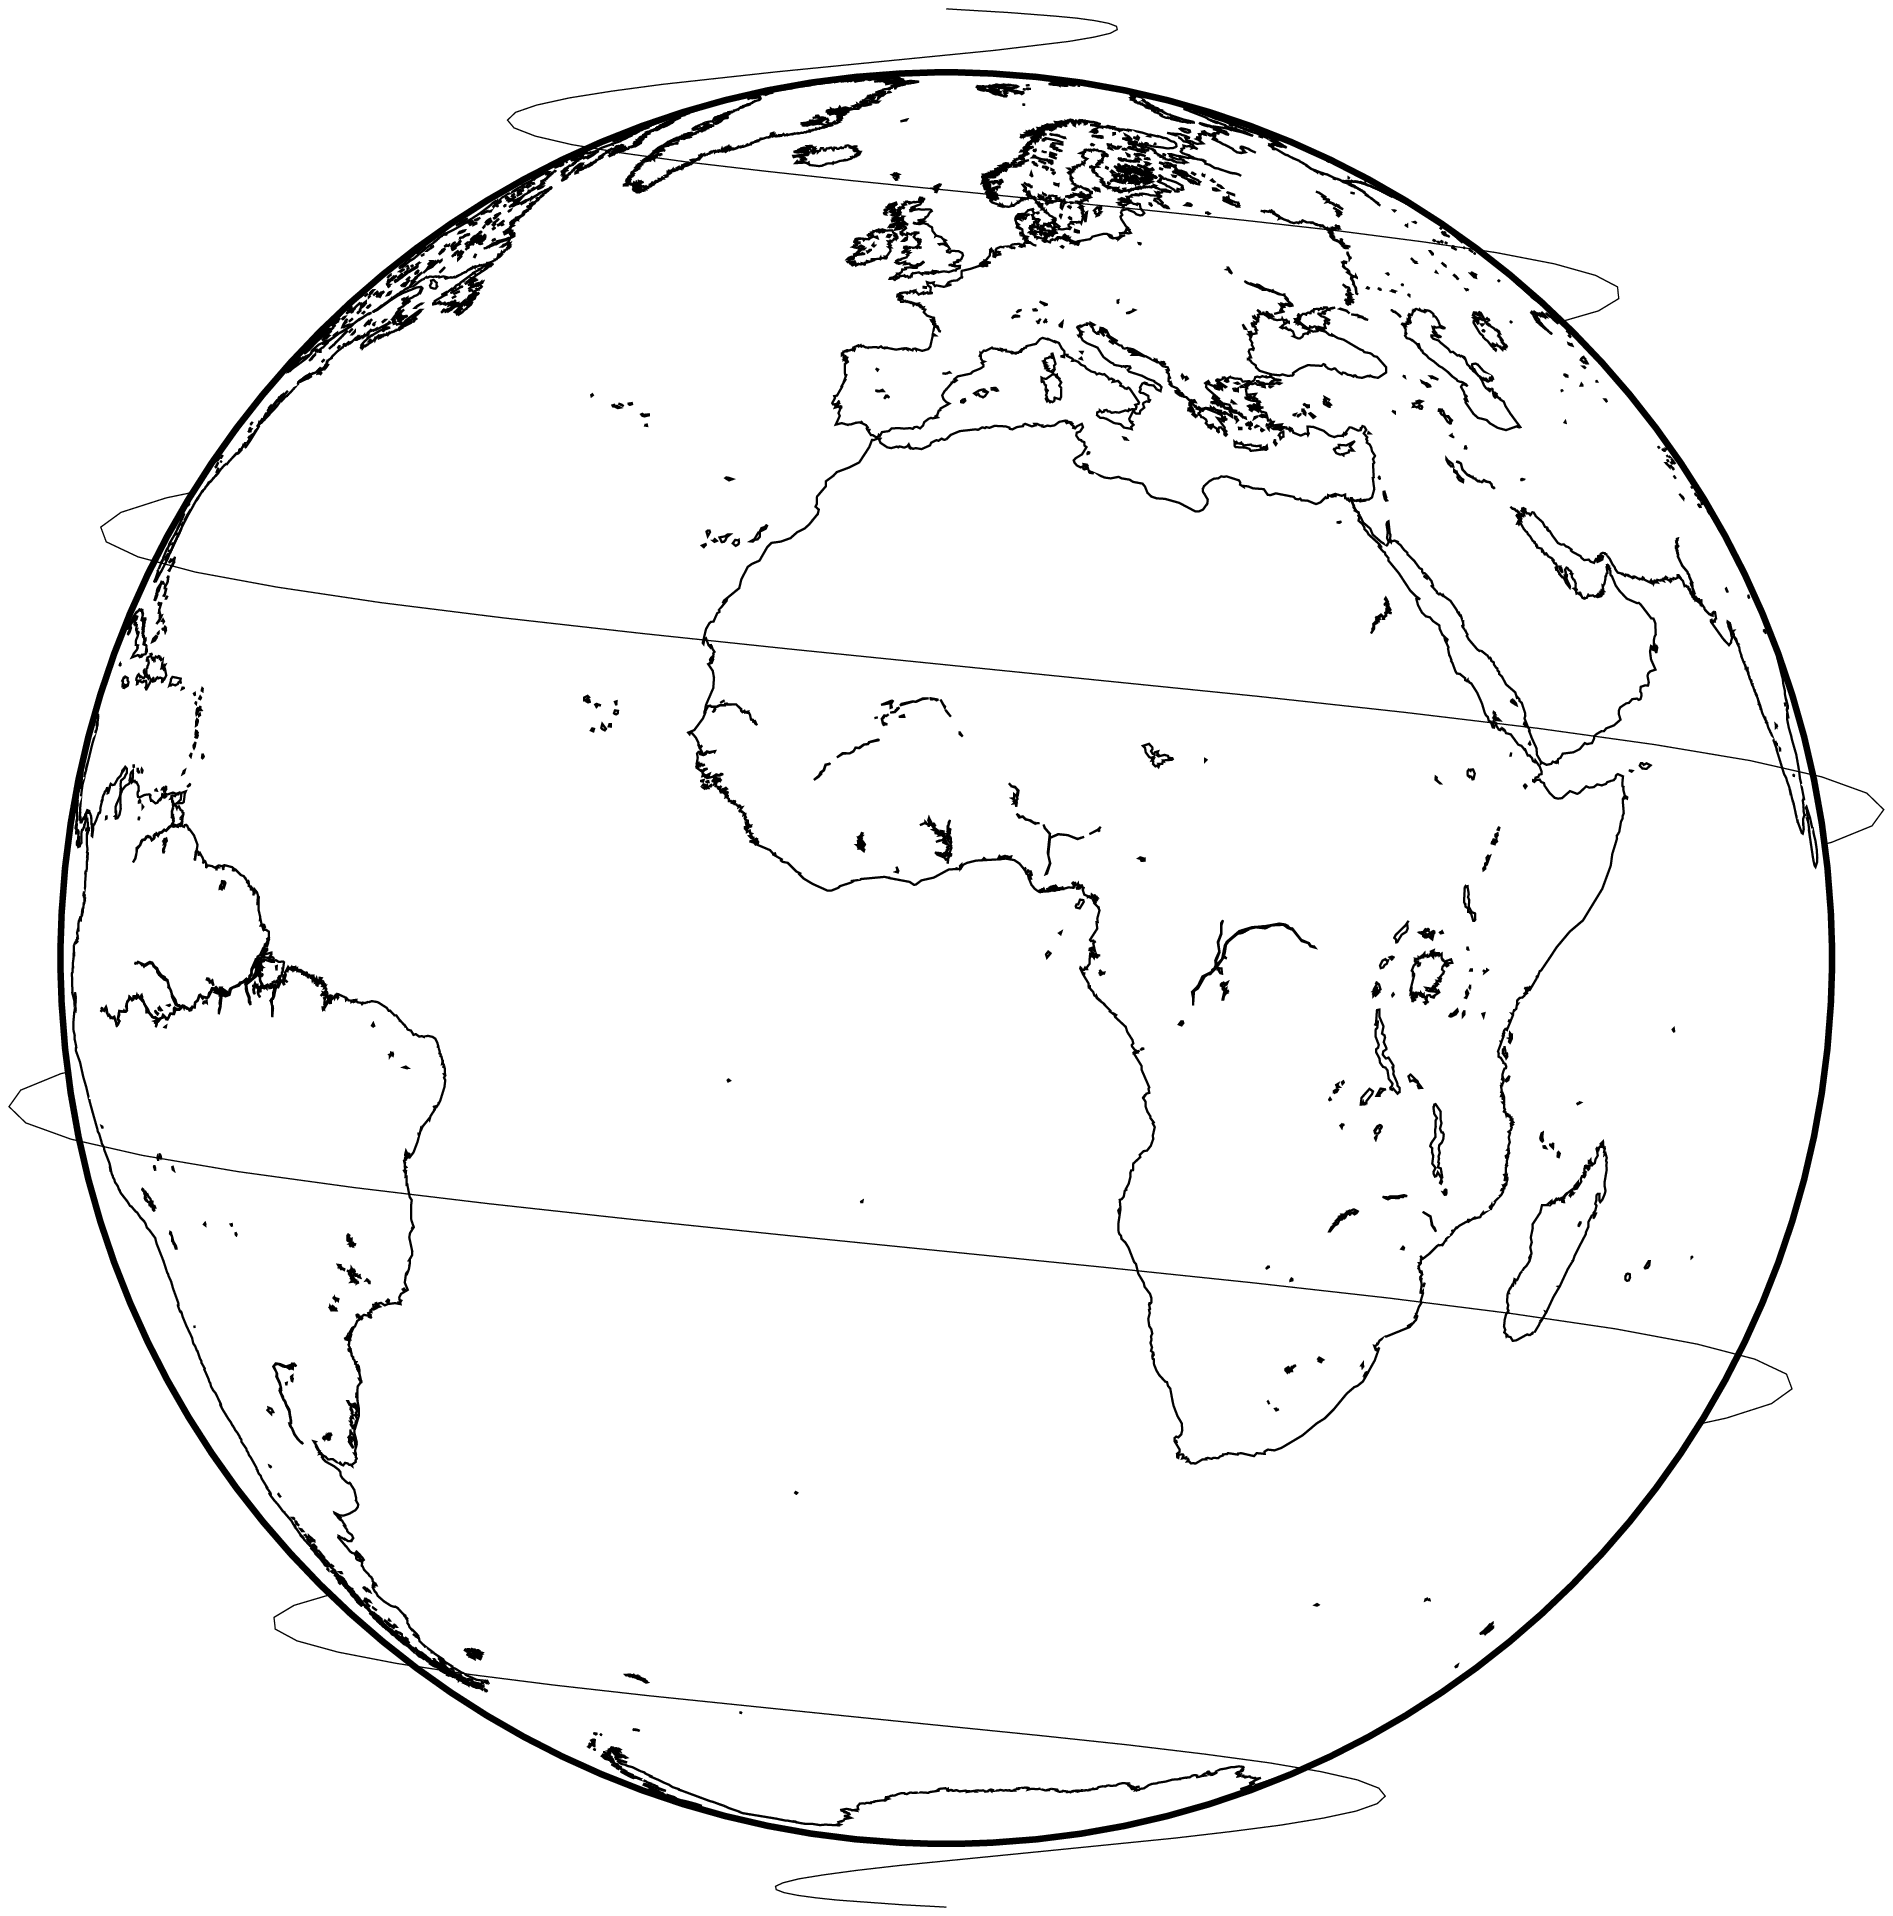
This example shows how we can plot data above the Earth (or any other celestial body) surface. The orbits will take care of the hardest part, which is the hiding of points that lay on the backside of the sphere. This function normally expects data in Earth Centered Earth Fixed (ECEF) coordinates but is has also a demo mode where user doesn't need to provide any data.
using GMT
orbits(show=true)
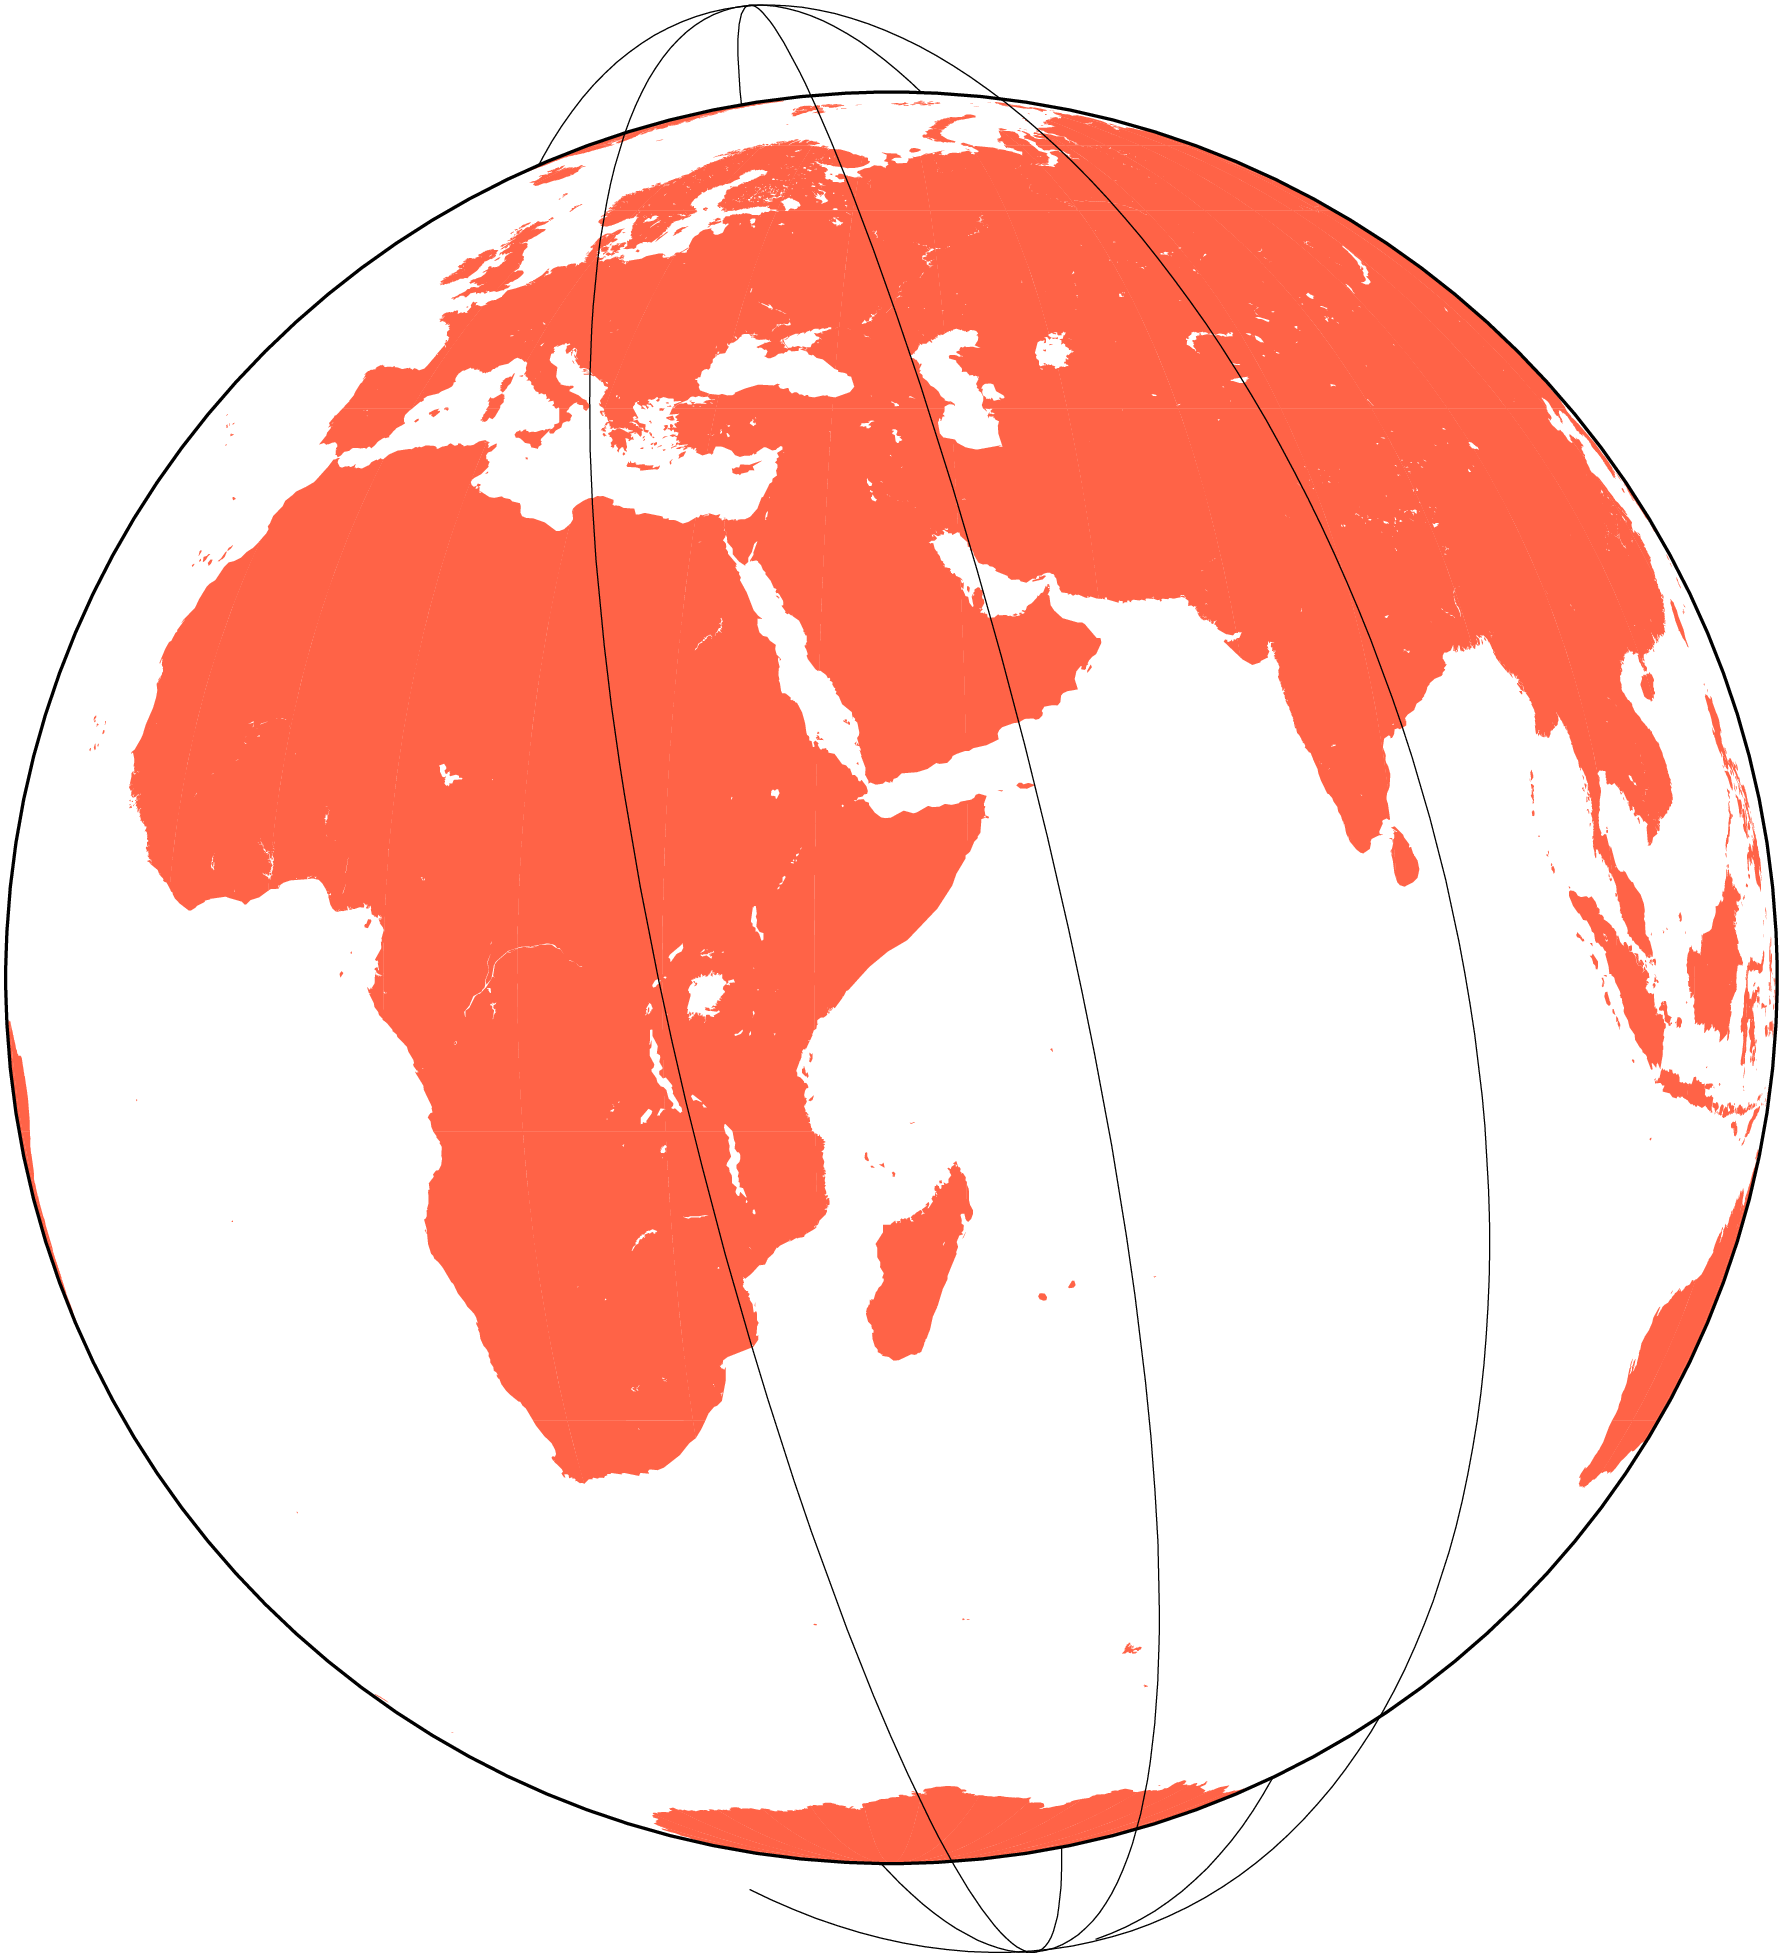
But a more realistic example is one where we plot the orbits of a satellite. Next example shows a couple track of the Aqua satellite. To compute the orbits, we need the help of the RemoteS package, that in turn use the so called Two-Line Elements orbit descriptor.
using GMT, RemoteS, SatelliteToolboxTle, SatelliteToolboxPropagators, SatelliteToolboxTransformations

# Compute some Aqua orbits for ...
orb = sat_tracks(tle=["1 27424U 02022A   23229.43455053  .00001116  00000-0  25175-3 0  9994";
                      "2 27424  98.2892 173.6510 0001539  53.4328  93.9112 14.58243961132289"],
                 start="2023-09-03T08:00:00", duration=300, geocentric=true);

orbits(orb, lon0=45, land=:tomato, show=true)
orbits(gmtread(TESTSDIR * "assets/orbits_aqua.dat"), lon0=45, land=:tomato, show=true)
© GMT.jl. Last modified: January 10, 2025. Website built with Franklin.jl and the Julia programming language.
These docs were autogenerated using GMT: v1.33.1